A-Level Physics Required Practicals:
Investigating the Discharge of a Capacitor
All the new specifications include a required practical that asks students to investigate capacitors charging or discharging through a resistor. The awarding bodies agree that this practical is an ideal opportunity for students to develop their skills in using ICT.
What’s in the Film
It’s possible to measure the changing potential difference across the capacitor using:
- A voltmeter and stopwatch.
- An oscilloscope (whether cathode ray or digital, for example a Picoscope).
- A datalogger.
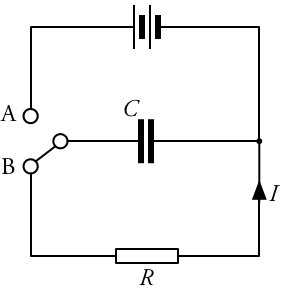 The circuit will be similar whichever approach you use. A meter connected in parallel across the resistor R measures V. With the switch connected at A, the capacitor C charges (almost instantly, since there is negligible resistance in the circuit). When the switch is flicked to position B the capacitor discharges through the resistor, with both the current and voltage decreasing exponentially.
In their experiments, both Alom and Carol do without a two-way switch and instead simply disconnect the capacitor from the power supply to make it discharge through the resistor.
As Alom mentions in the introduction, the uses of capacitors are quite interesting for giving the students some context here. He refers to a previous film:
The Datalogger Method
In core practical film, Alom uses Edu-lab data loggers (see below for approximate costings), but there are many alternatives. You could also use a digital oscilloscope which stores data, or a computer-based ‘Picoscope’ or similar which functions equivalently.

From 1’32” in the film Alom suggests that students can check the discharge curve is exponential by seeing if there is a constant half-life (the time taken for the potential difference to fall by a half). Or, better, to measure the time constant and if it that is… er… constant (the time constant is the time taken for the measured potential difference to drop to 1/e of its original value – see the graph above).
Earlier in the film, Alom chooses values for C and R which multiply to give a time constant which is measurable: neither too fast nor too slow. In this case:
\(C = 4700~\mathrm{\mu F}\)
\(R = 10~\mathrm{k\Omega}\)
So time constant \(\tau = 4700\times10^{-6} \cdot 10 \cdot 10^3 = 47~\mathrm{s}\)
The exponential equation:
\(V = V_{0}e^{-t/RC}\)
is one which students will need to be able to handle. Alom shows how to manipulate this into the form of a straight-line graph. First, take natural logs of both sides:
\(ln(V) = ln(V_0) – \frac{t}{RC}\)
Compare with:
\(y = mx + c\)
If \(ln(V)\) is plotted on the y-axis against \(t\) on the x-axis, then \(ln(V_0)\) will be the y-intercept and \(-\frac{1}{RC}\) the gradient, hence \(C\) if \(R\) is known.
Resistor colour code
This might be a useful opportunity to show students the resistor colour code:
- Wikipedia page.
- The best little web app we’ve found for calculating and interpreting resistor bands. —Seriously, this page is awesome. We have it as a shortcut on our browser toolbars.
Questions
You might like to ask your students:
- Why is a datalogging method appropriate for this practical?
- Does it matter which way round we connect the capacitor? (see Carol’s comment at 3’21”).
- For how long should we time the discharge?
- What would happen if we instead measured V while the capacitor charges?
- Why process the data so we get a straight line graph? Why is this better than a curve?
- What should the units of \(ln(V)\) be?
The Direct Measurement Method
Carol uses a multimeter as a voltmeter and a stopclock to do the timing manually. She suggests measuring V every ten seconds: it’s hard to record it any more frequently, but take less frequent measurements and the graph will be hard to draw, with too few data points. Any voltmeter will do: digital, analogue, multimeter, or even an oscilloscope.
Students could be challenged to find an unknown capacitance by measuring the time constant obtained with a particular resistor. In the film, Carol explains that some preliminary runs will be needed to test the circuit and to ensure they have a suitably measurable time constant.
This method lends itself to the use of ICT, in that students can put their data into a spreadsheet and manipulate them into a straight line for (as shown above). Alternatively, data can be processed by hand.
You might as your students:
- Why do we not need to worry about starting the timing immediately the discharge begins? (This will test their understanding of the exponential decay function.)
- What are the causes of uncertainty in the experiment – not only our measurements, but the manufacturers’ tolerances for their components?
- How can we reduce the uncertainty in our readings?
Safety
Since \(Q = CV\), a large capacitor charged to a huge voltage stores a lot of charge, which will lead to a high initial charging or discharging current, with consequent heating effect. The values used in the film (and noted above) offer a good guide to what works well – and safely.
Capacitors should not be charged to a voltage higher than that stated on their labelling or product information sheets. Electrolytic capacitors should be connected with the correct polarity.
It’s also important to ensure the capacitor is discharged before touching it: disconnect the power, then operate the circuit to discharge the capacitor through the resistance before dismantling the apparatus.
Costs
The Edu-logger system used in the film sells for around:
- £45 for the voltage sensor
- £43 for the USB module to connect to a PC (standalone display/tablet/smartphone alternatives are available).
- £43 for a battery module.
Those figures are without VAT. Other systems are available for similar prices, or you can spend considerably more on systems with increasing levels of flexibility. Most suppliers will offer discounts on bulk orders.
Further work
The IOP’s Teaching Advanced Physics website has a series of articles about teaching topics around capacitance:
Assessment
Common Practical Assessment Criteria
At the time of writing, the exam boards appear to agree that this practical might be used to address, in whole or in part:
- CPAC 3: Safely use a range of practical equipment and materials.
- CPAC 4: Makes and records observations.
Student Worksheet
We’ve drafted a student worksheet for this practical, which you may find useful as a starting point:
- Capacitor discharge lab manual (Word .docx)
Comments & Feedback
As ever, no single film can encompass everything one might wish to say about a practical. Please, leave comments with your thoughts about the approach we’ve taken, and your suggestions for alternatives or improvements.
Leave a Reply
Want to join the discussion?Feel free to contribute!


We have the job of performing a least squares fit to the data using a program like MatLab (if I had some code to start with) to compute the internal reistance of a voltmeter.