Tinkering Thursday: 19th Feb “In the swing of it” pendulum edition
Our charmingly softly-spoken volunteer Andrew is filling in some time before his own physics degree by… actually, I’m not entirely sure why he’s here, but he didn’t seem to mind when I dropped a Bare Conductive Touchboard set in front of him and said ‘Here, get that working.’ We always have things going on we can rope people into.
Touchboard is a nifty little circuit board which integrates an Arduino controller, an audio engine, and a multi-channel capacitance sensor. If you’ve seen Makey-Makey, it’s a bit like one of those only with a whole raft of other bits bolted on. It’s more expensive, but much more capable.
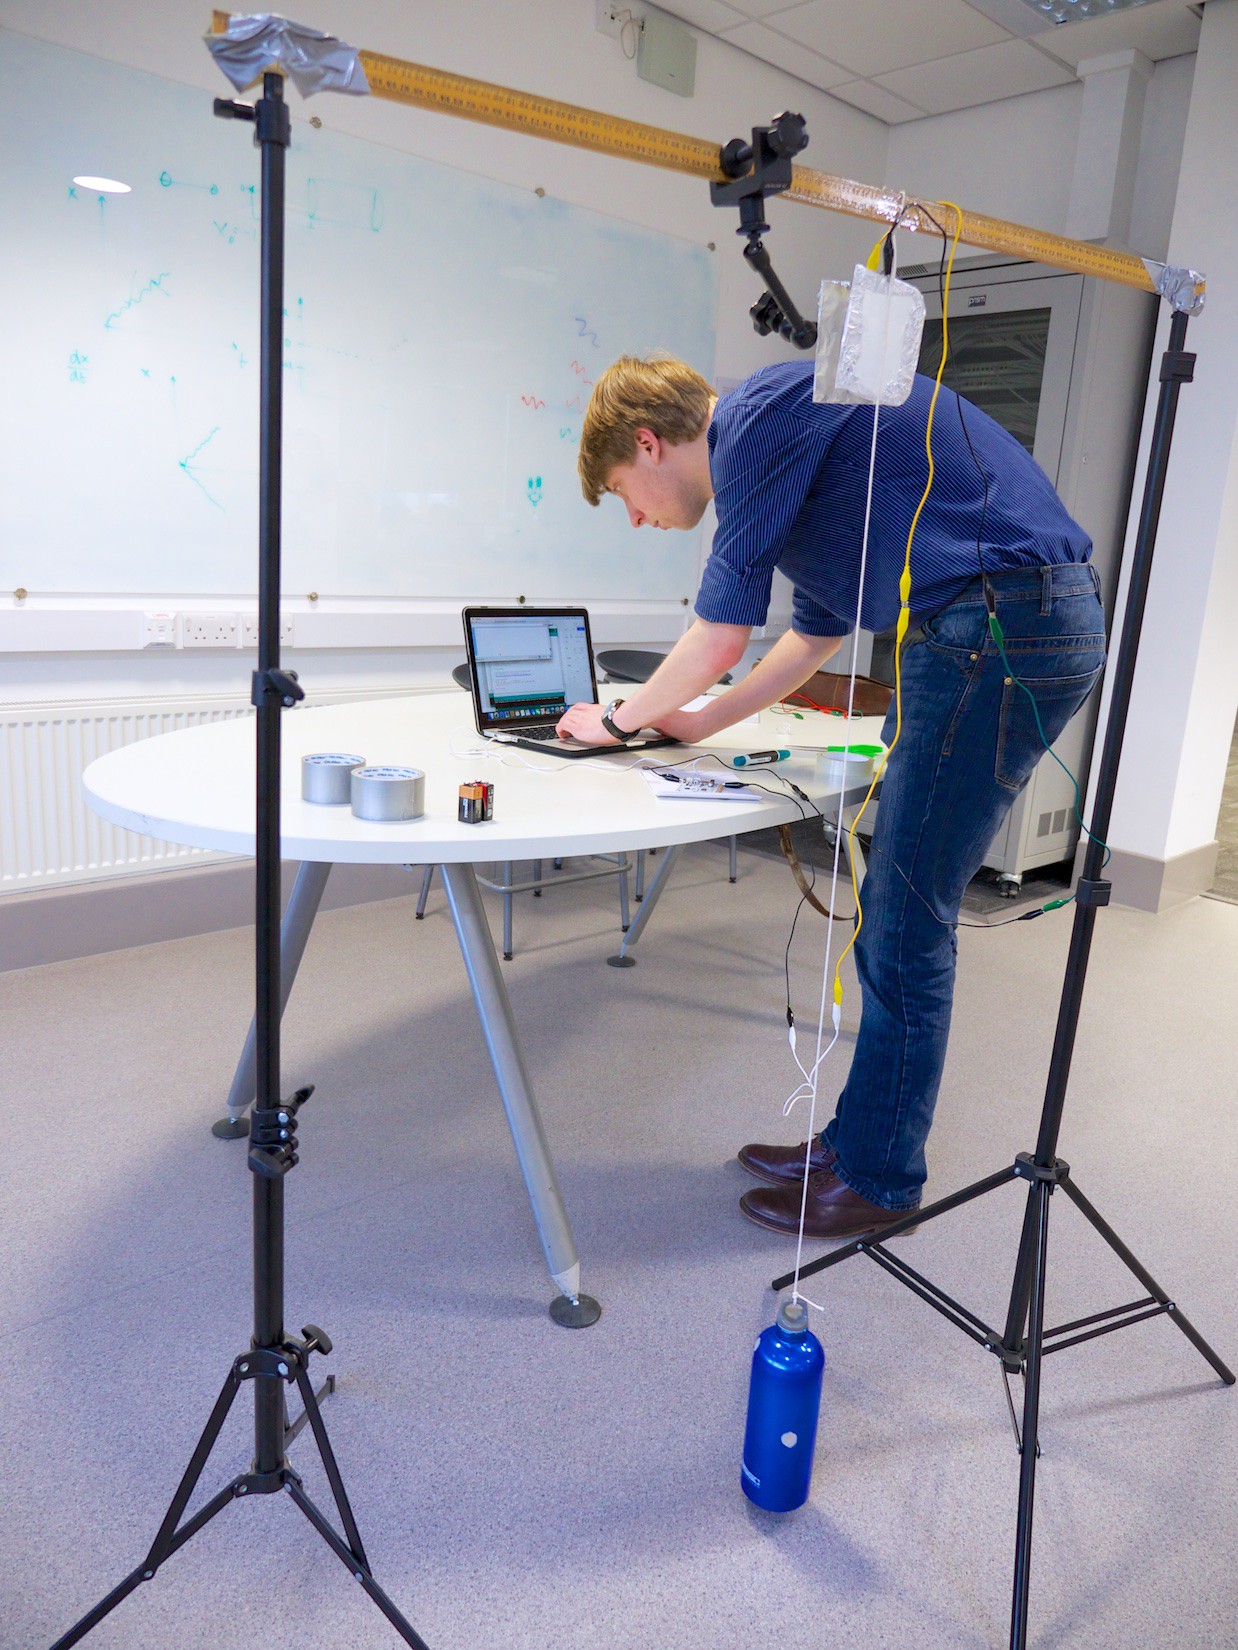
Andrew fettles an instrumented pendulum
I have a bit of a masterplan to build an installation piece for Maker Faire UK that involves generating sounds (or maybe light, we’ll work that out as we go) which respond to pendulum movement. Creeping ever higher on my list of ‘Things I really should have done before now’ has been powering up a Touchboard and seeing how we might use it to extract data from a moving pendulum, which was the task I set Andrew on today.
There he is at right trying different approaches, attaching foil-plate electrodes to the Touchboard and logging the raw sensor output over a serial link. As far as I can tell he’s never done this sort of thing before, so it’s a testament to Bare’s tutorials, the approachability of this sort of tinkering, and particularly Andrew himself that he produced this:
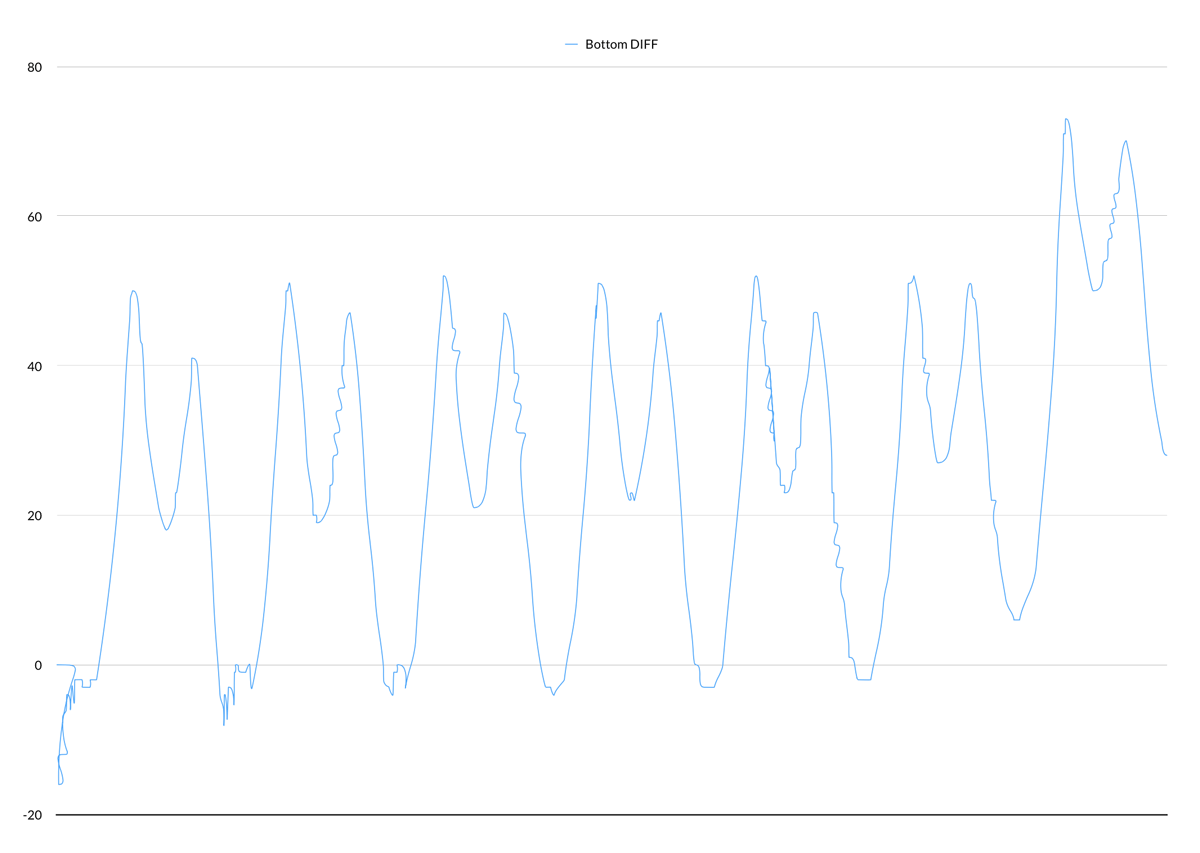
…which is a pretty clean trace. That’s with one electrode stuck to the bottom of the pendulum bob (my water bottle – the blue thing in the photo) and the other resting on the floor.
It took us a while to work out why there’s a double peak on each swing. We think that’s about the geometry of how the plates face each other as the pendulum swings past dead-centre.
The photograph shows a different arrangement, where we attached the plates up by the pivot point of the pendulum. There are several reasons we thought this might work:
- The capacitance sensor has a limited range, so the smaller motion at the top of the pendulum is beneficial.
- The electrode plates are quite large, so the one attached to the pendulum presents a large surface area for air resistance. Along with smaller displacement goes lower speed, so there should be much less damping from the plate up at the top than if it were attached lower down the string.
- There’s less of an effect from the natural decay of the pendulum amplitude anyway.
 Happily, the trace from there looked like the one to the right: much more sinusoidal. At the bottom of the waveform you can see where the sensor plates are furthest apart, and noise starts to creep in. It’s not bad, though – there’s clearly something there we can work with.
Next steps include exploring the audio capabilities of the board, and we talked a little about Fourier techniques and processing the data to extract frequency information.
I’m excited to be underway with this at last. I’m absolutely unsure if where we’re heading is physics or kinetic sculpture, and I’m entirely happy about that: there’s something very appealing to me about taking simple objects and mechanisms, instrumenting them, and using the data collected in creative and interpretive ways.
We’ll see where the investigation goes, and we’ll keep you posted with progress.
![]()